


Observability in Linux Performance: A Visual Guide
In today’s world, where the performance of systems is critical to business success, understanding and monitoring Linux performance is more important than ever. The visual guide provided above is a powerful tool for system administrators, DevOps engineers, and SREs to gain insights into the various components of a Linux system, from hardware to applications, and how they interact.
Understanding the Layers of Linux Performance
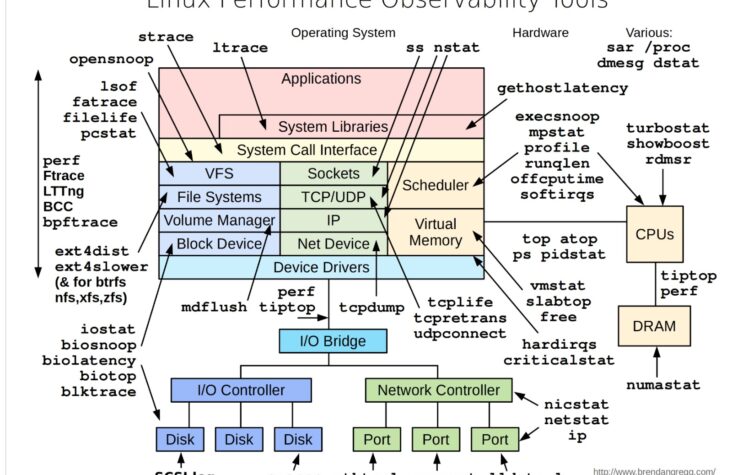
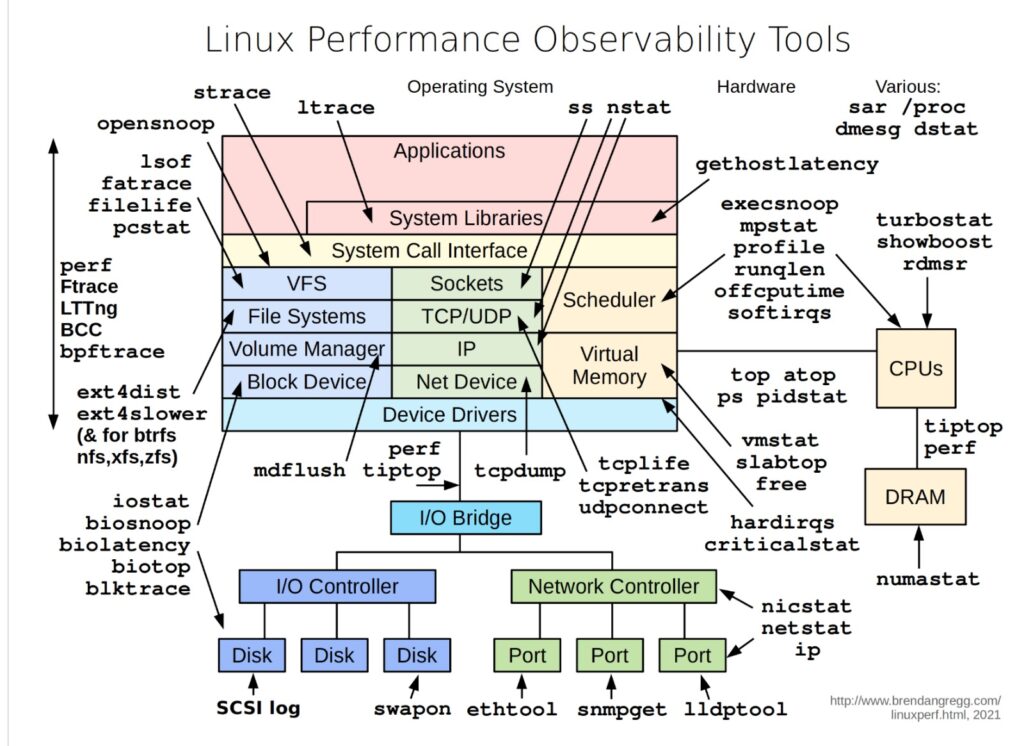
The diagram breaks down Linux performance observability into multiple layers, each representing different parts of the system:
- Applications and System Libraries: Tools like
straceandltraceallow you to trace system calls and signals. These tools help in understanding how applications interact with the system libraries and can be crucial for debugging performance issues in complex software stacks. - System Call Interface: This is where the kernel mediates between the user space and hardware. Tools like
perf,Ftrace, andbccallow for deep analysis of how system calls are handled, providing insight into how efficiently the kernel is managing tasks. - File Systems and Network: For file system monitoring, tools like
ext4distandblktraceoffer detailed insights into how data is read and written, which is essential for diagnosing storage performance issues. On the network side,tcpdump,ss, andnstatprovide visibility into socket and network device performance. - Hardware and Drivers: At the hardware level, tools such as
mpstat,iostat, andbiosnoophelp monitor CPU, disk I/O, and memory usage. These tools are critical for understanding the physical limitations of your hardware and how well the system is utilizing these resources.
Example Use Cases
- Diagnosing High CPU Usage: Suppose an application is causing high CPU usage. By using
perfandmpstat, you can track down which system calls are consuming the most CPU time and whether the issue lies in the application code, system libraries, or even the kernel itself. - Network Performance Troubleshooting: If you’re facing slow network performance,
tcpdumpandsscan help you analyze the traffic at the socket level, identify bottlenecks, or detect misconfigurations in the network stack. - File System Bottleneck Identification: When dealing with slow disk operations, tools like
blktraceandext4distallow you to trace file system activity and identify whether the issue is due to disk I/O, file system configuration, or even the application’s interaction with the file system.
Conclusion
This visual guide is not just a map but a toolkit that offers a structured way to approach Linux performance issues. Each tool has its place, and by understanding where and how to use them, you can effectively diagnose and resolve performance bottlenecks, ensuring your systems run smoothly and efficiently.
For anyone serious about maintaining high-performance Linux environments, mastering these tools and understanding their use cases is not optional — it’s essential.