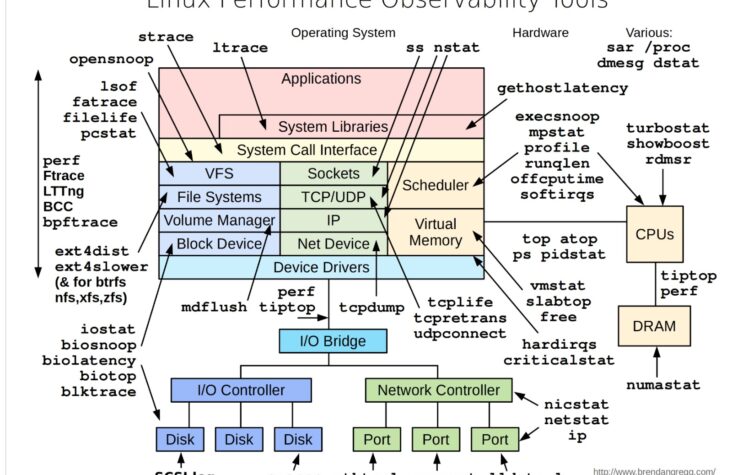
Observability in Linux Performance: A Visual Guide

In today’s world, where the performance of systems is critical to business success, understanding and monitoring Linux performance is more important than ever. The visual guide provided above is a powerful tool for system administrators, DevOps engineers, and SREs to gain insights into the various components of a Linux system, from hardware to applications, and how they interact. Understanding the Layers of Linux Performance The diagram breaks down Linux performance observability into multiple layers, each representing different parts of the system: Example Use Cases Conclusion This visual guide is not just a map but a toolkit that offers a structured way to approach Linux performance issues. Each tool has its place, and by understanding where and how to use them, you can effectively diagnose and resolve performance bottlenecks, ensuring your systems run smoothly and efficiently. For anyone serious about maintaining high-performance Linux environments, mastering these tools and understanding their use cases is not optional — it’s essential.

Common Mistakes we do while Configuring Prometheus and AlertManager on EKS Cluster

Prometheus and AlertManager are one of the most in-demand tools used for Monitoring & Alerting in the industry currently. They are one of the efficient tools to be used for monitoring your EKS cluster along with the custom metrics you are pushing.However, with this configuration we tend to make lot of mistakes which makes our deployment difficult. I have tried to collate all the common mistakes we do while configuring and deploying Prometheus and AlertManager which will help us to deploy the Prometheus stack in smoother way. Configuring Prometheus and Alertmanager on an Amazon EKS cluster can be a bit complex due to the various components involved and potential pitfalls. Here are some common mistakes that people might make during this process: Prometheus needs to be able to discover and scrape the metrics endpoints of your applications. Incorrectly configuring service discovery, such as using incorrect labels or selector configurations, can result in Prometheus not being able to collect metrics. Fix: Ensure correct labels and selectors for Kubernetes services and Pods. 2. Improper Pod Annotations or Labels: In Kubernetes, pods need to have appropriate annotations or labels to be discovered by Prometheus. If these annotations or labels are missing or incorrect, Prometheus won’t be able to locate the pods for scraping. Fix: Add the correct Prometheus Annotations or Labels to your pods. 3. Insufficient Resources: Prometheus can be resource-intensive, especially as the number of monitored targets increases. Failing to allocate sufficient CPU and memory resources to your Prometheus pods can lead to performance issues and potential crashes. Fix: Allocate sufficient resources to Prometheus Pods 4. Misconfigured Retention and Storage: Prometheus stores time-series data, and its retention and storage settings need to be properly configured to match your use case. Failing to do so can result in excessive storage usage or data loss. Fix : Configure retention and storage settings in Prometheus configuration.